by chris chris No Comments

Carillion – where did it all go wrong?

Carillion has disappeared from the annual contracts leagues after one of Britain’s biggest contractors filed for compulsory liquidation on 15 January 2018

What went wrong at Carillion is still being worked out, but the company has been consistently ranked amongst the industry’s top 20 contractors by orders according to Glenigan’s research.

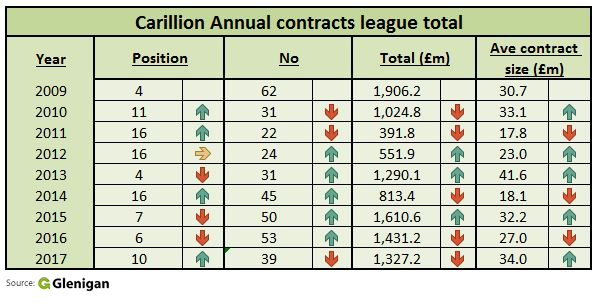
The highest end-of-year ranking in the past decade was fourth, which was achieved in 2009, when orders totalled £1.9 billion, and again in 2013 with a smaller order book (see table).

Glenigan’s research, which excludes term maintenance and framework agreements, shows a clear reduction in contracting workload in 2011 and 2012.
This came as the group moved further into support services and facilities management work and acquired heating and renewable energy group Eaga for £306 million in 2011.

This acquisition did not work out as tariffs on solar energy were reduced, while other support services work did not produce the returns that the management expected.

As a result, Carillion sought more contracting work, which typically aids cash balances albeit only in the short term as this money needs to be paid out to the supply chain.

This return to contracting work pushed up the orders total and also raised the risk profile as the company took on larger projects, which typically carry more risk as problems with delays can be costly.

In 2013, Glenigan’s research shows that Carillion’s annual order book ballooned by 134% and the size of the average construction contract won by the company leapt by 81% to £41.6 million.

This measure subsided in 2015 but leapt again in 2016 as Carillion took on larger projects, such as the £745 million Aberdeen Western Bypass scheme.
Cost over-runs on this deal, which was won in joint venture with Balfour Beatty and Galliford Try, was among the troublesome contracts that took Carillion into liquidation.

In 2017, the size of the average contract won by Carillion had reached £34.0 million, which was the second highest in the last nine years. This rise was partly produced by taking on work on HS2 in the Midlands, which was where the company’s largest regional exposure could be found.

At the end of 2017, Carillion was ranked amongst the top 10 contractors by orders in four of the 11 British economic regions. The biggest regional exposure was in the West Midlands, where the company won £463.3 million-worth of work last year and was ranked fifth.

In the East Midlands, Carillion was ranked third with an order book totalling £240.3 million. In the North West, the group’s order book of £195.1 million left Carillion ranked sixth and orders totaling £95.6 million in Wales merited eighth place at the end of 2017.

As one of the industry’s biggest players disappears from league tables, an opportunity arises for small-to-medium-sized contractors to make a play for the work that will inevitably come up for grabs after Carillion’s liquidation.

by chris chris No Comments

Surge in detailed planning applications for new homes

The number of homes being proposed in detailed planning applications surged by 20% last year as proposals for private new-build units ballooned to their highest level in nearly 15 years.

Glenigan’s research shows that the number of proposals for private housing surged by 23% to 166,341 units compared to 135,278 units proposed in 2016.
As Glenigan’s research showed last month, the number of units in applications for social housing rose by 8% last year to 25,901 units – up from 24,039 units in 2016. This means that the total pipeline of new homes leapt by 21% in 2017 to 192,242 units.

Glenigan’s economics director Allan Wilen said: “We expect the underlying level of project starts to decrease by around 3% over the course of 2018 as housebuilders prioritise building out developments in fewer sites.

Newly Built UK Homes

“However, the development pipeline remains strong. Approvals have been rising at a healthy rate and the increase in applications in 2017 that this research shows suggests housebuilders remain relatively positive despite a more fragile near-term outlook due to uncertainties over interest rate rises and house prices.”

Glenigan’s research into the levels of units in planning applications started back in 2003, when detailed submissions for new private homes included 119,005 units. As the industry boomed, the pipeline surged to 164,197 units in 2004 only for the development pipeline to slump as the recession bit a few years later. That 2004 total remained unsurpassed until last year’s boom.

Glenigan’s data also shows housebuilders continuing to increase their exposure to more family-friendly houses at the expense of apartments.
Prior to the crash, 33.6% of proposed new homes were apartments and 61.8% were houses, but that changed as the recession led to a serious over-hang of unsold flats in urban locations.

In 2017, the total number of flats in the pipeline did rise 16.5%, but the number of new homes surged by 25%. As a result, the proportion of flats in the planning pipeline contracted to 11.4%, while proposals for some form of house rose to 86.5% from 85.2% in 2016. Applications for flats and homes are still rising, but there was barely any change in the number of applications to build bungalows and the pipeline for retirement homes shrank by 8%.

Mr Wilen added: “This fall may be attributed to the government’s decision to ban the sale of new homes on a leasehold, which was brought in at the end of last year after a campaign in the media. “Our data suggests that appetite for building new retirement homes may have been adversely affected.”

On the day that the ban came into force in December 2017 shares in McCarthy & Stone – Britain’s biggest retirement home builder – slumped by nearly 10% and the company’s chief executive Clive Fenton warned the leasehold ban “will result in a disruption of supply”.

While predictions of disruption in starts in this house type might bear out in the short-term, the pipeline of houses and flats is stronger than ever.